
California projects large increase in COVID-19 hospitalizations, but not in Bay Area
With California state officials seeing “early signs” of increased coronavirus spread, the state’s modeling system projects a dramatic increase in COVID-19 hospitalizations by the end of October.
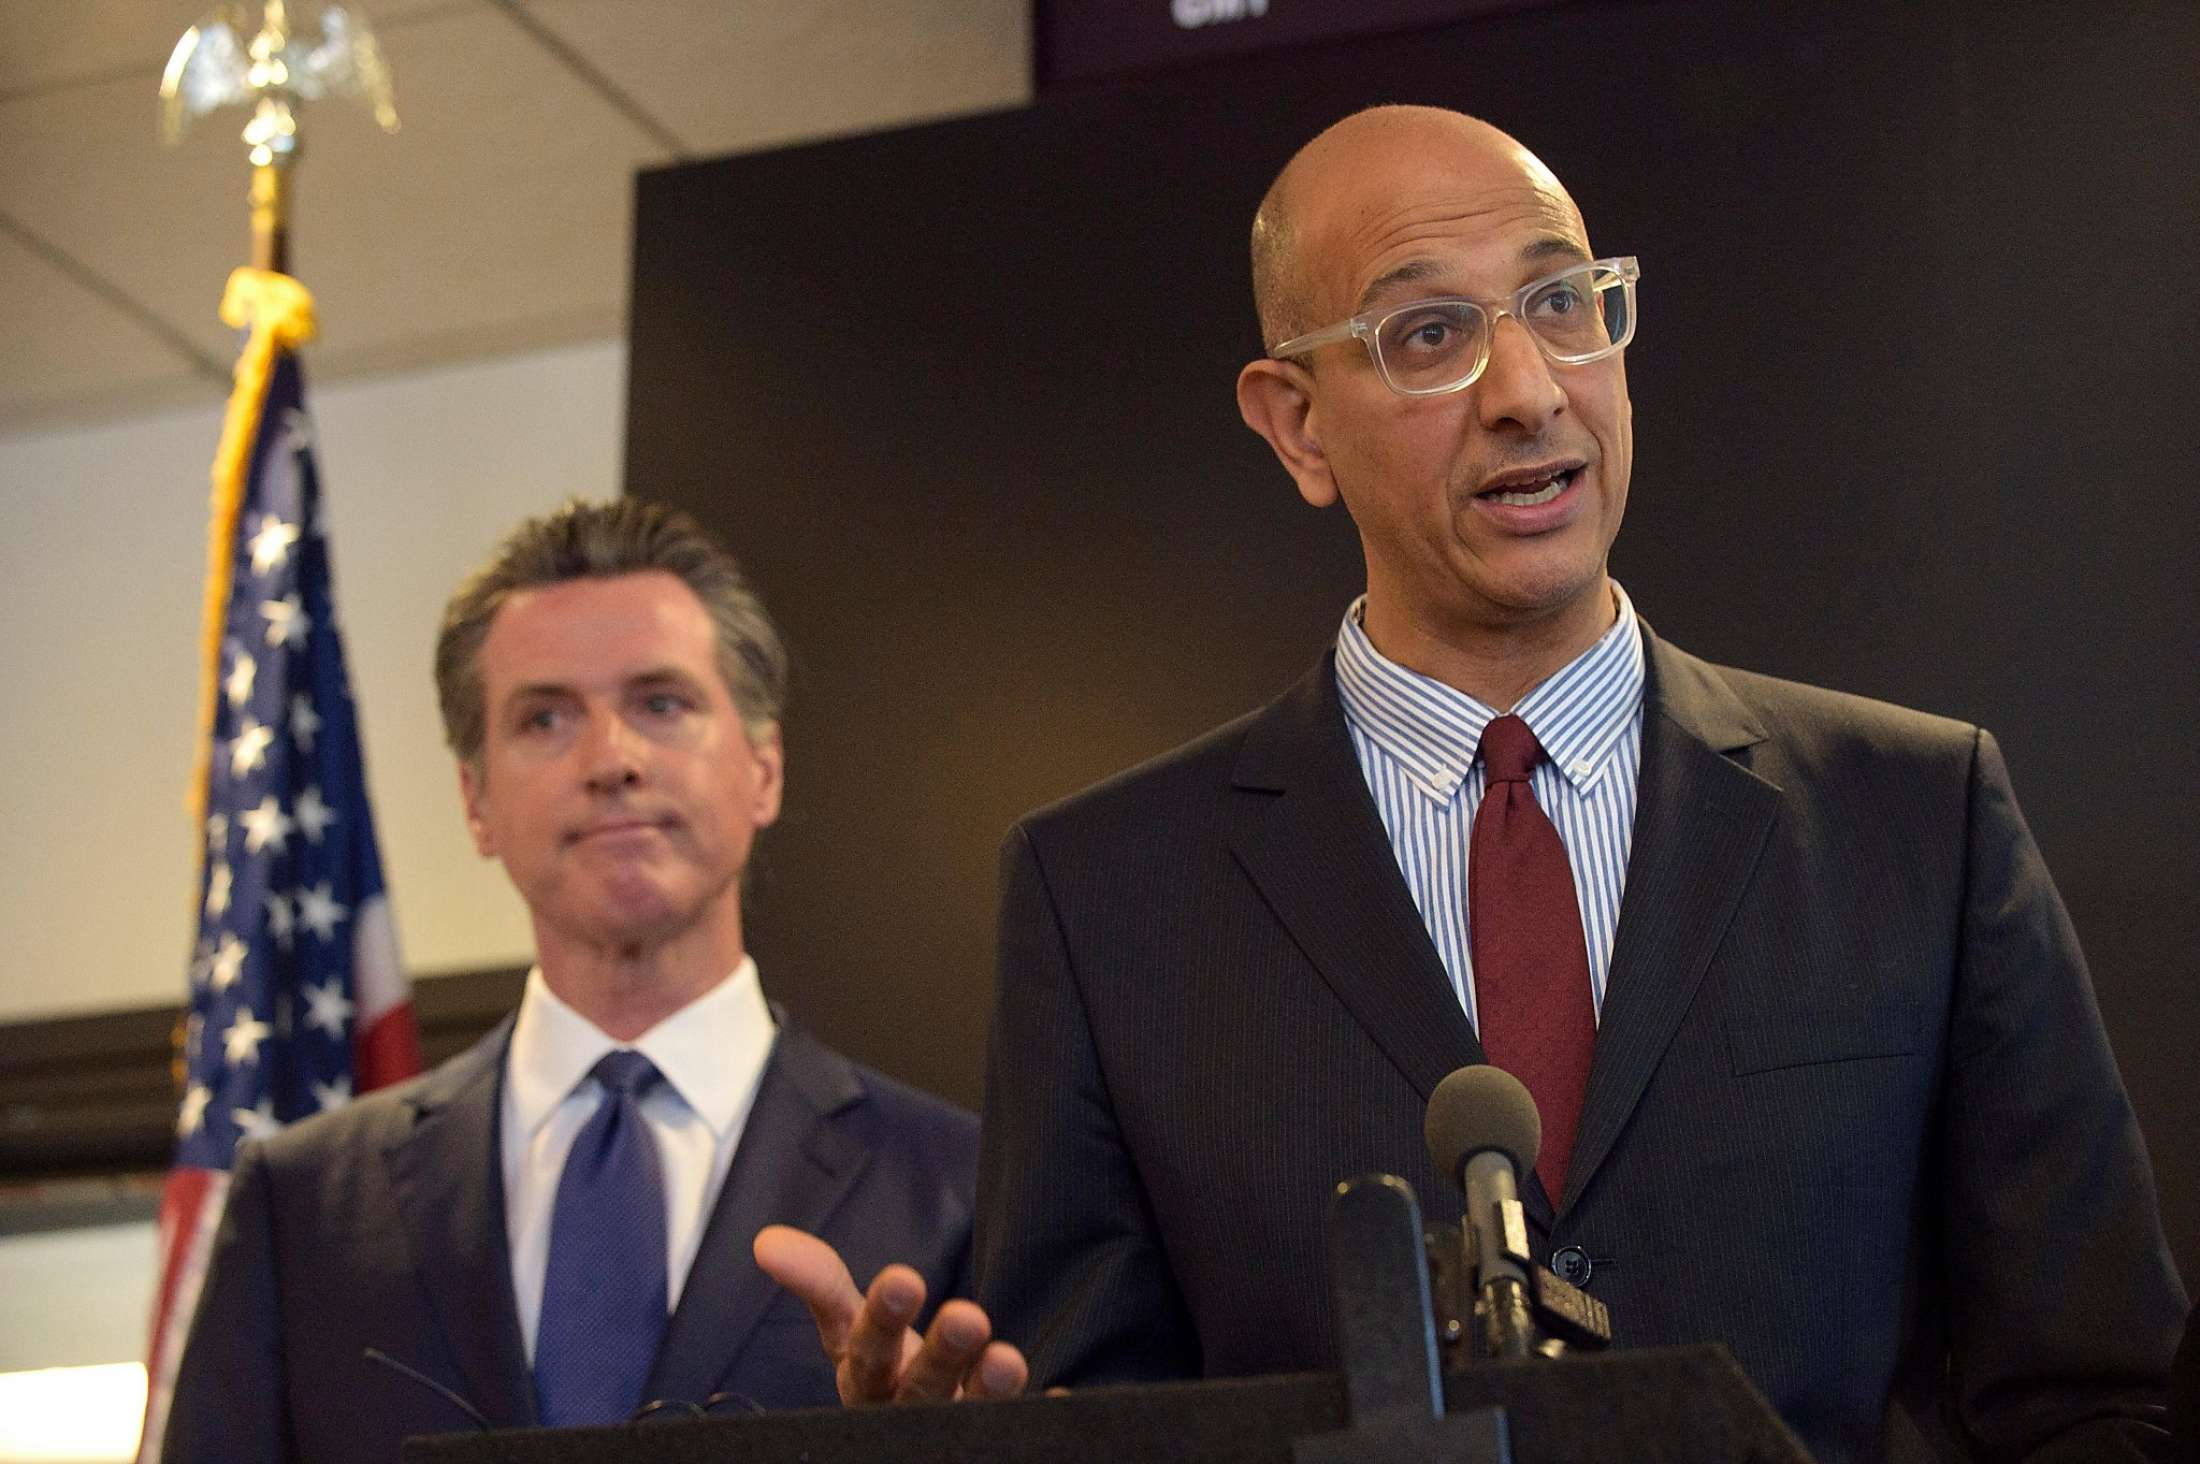
During a virtual event Friday, California Health and Human Services Secretary Dr. Mark Ghaly said that across the state, “cases are certainly going up,” as are hospitalizations in some regions. Ghaly attributes the increases to social gatherings from Labor Day as well as the reopening of businesses that began the week of Aug. 31.
“Our short-term forecast for today’s conditions predicts an increase in hospitalizations a month from now,” Ghaly said. “Currently, we’re at 2,578 confirmed COVID-positive individuals in the hospitals, but a month from now… our projections show that we’ll be just shy of 5,000 hospitalizations. Now, we’ve seen that before. We’ve d0ne a good job to bring that down, and certainly our hospital system with the wonderful partners we have are able to take care of that level of patients. That said, we’ve never done COVID hospitalizations with flu hospitalizations.”
The state’s CalCAT modeling system’s “ensemble projection” — created by averaging projections from models from MIT, Johns Hopkins University, Stanford University and others — projects a near-doubling of statewide COVID-19 hospitalizations by the end of October.
However, there are reasons to be skeptical of the state’s projections. In the statewide graph below, notice how the the black line, which represents the actual number of hospitalizations, has been consistently underneath the colored lines representing the various models. I.e., many of the models are overshooting.
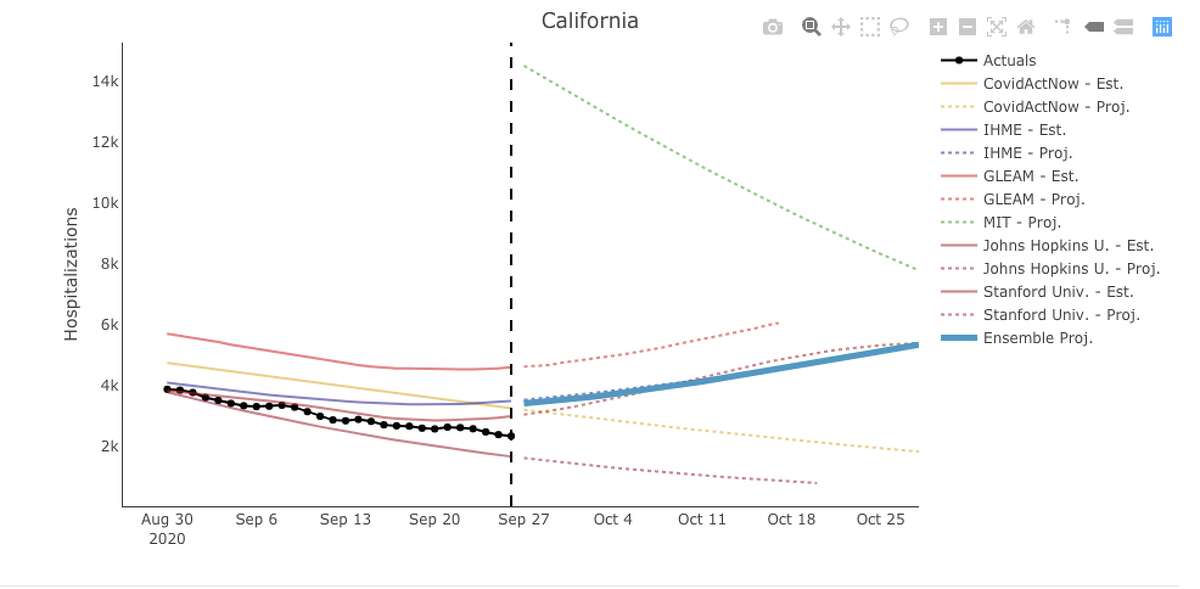
In addition, notice how three of the models — IHME, GLEAM and Johns Hopkins — projected that California’s hospitalization increase should have started last week, while the number of actual hospitalizations has continued to trend downward over the past seven days.
Looking to the projections side of the statewide graph, only three of the six models — GLEAM, IHME and Johns Hopkins — project an increase through the month of October, while the other three — Stanford, MIT and COVID Act Now — actually project a decrease. Furthermore, while the MIT model projects a decrease, it projects that the state of California should currently have 14,525 COVID hospitalizations. It has 2,338.
Some of the county-level modeling is even noisier. Contra Costa County is the only Bay Area county projected to have a dramatic increase in hospitalizations over the next month, but like the graph for statewide projections, there’s a lot of model divergence on Contra Costa’s graph.
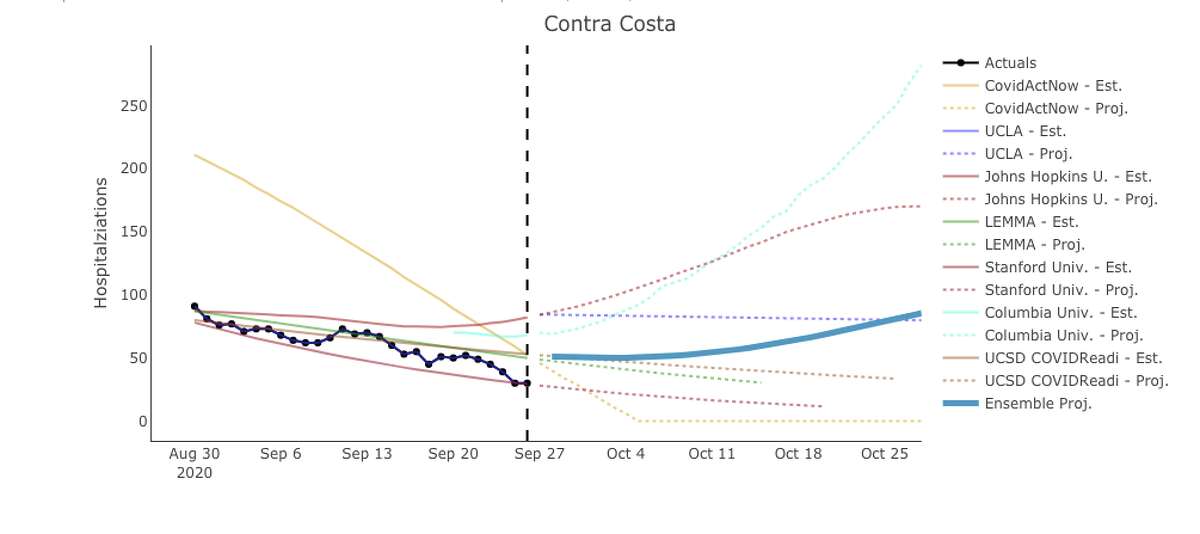
The three models that have come closest to projecting Contra Costa’s actual number of hospitalizations — LEMMA, UCSD and Stanford — all project a decrease in hospitalizations through October.
For other Bay Area counties, there’s more model agreement. The state projects that for San Francisco, Alameda and Santa Clara counties, hospitalizations will be mostly flat or decreasing over the next month.